

Presence Sensor
Overview
A mm-wave based smart home occupancy sensor. This post covers only the straight-line progress of this project, since a full build log would be far too long for this format.
Traditionally, Passive InfraRed (PIR) sensors have been used in residential and commercial motion sensing applications. They are reliable and responsive and are a good fit for many applications, but have significant shortcomings when it comes to use in home (and commercial building) automation. Mainly, while they excel at detecting large movements, they struggle to detect people who are sitting, standing, or lying still. This is why you might see the automatic lights in a bathroom or office turn off while you’re sitting still, or why many home automation early adopters might be familiar with the flailing motion that can be used to turn the lights back on after one has been sitting on the couch for a while.
New mmWave radar sensors overcome this limitation by being sensitive enough to detect people even when they are mostly still by detecting the slight movements of fidgeting, breathing, or pulse.
This device leverages this new technology and combines it with an attractive enclosure and custom radar processing algorithm to achieve higher accuracy than many low-cost commodity devices in an attractive package.
Enclosure

The enclosure is key to the user experience, as it is what they will see and touch during setup and while the device is in operation. Additionally, it drives device form factor and production rate, as it is printed and post-processed in-house. In order to best meet these objectives, the following requirements were set
Minimal additional hardware - adding screws, inserts, magnets, and other vitamins adds assembly steps, increases BOM cost, and extends production time and complexity
Cohesive design language - Cutouts, ports, vents, and other features break up the design and make it less pleasing to look at
No wires - Design should allow installations with in-wall wiring to be executed with no visible cables
Radar considerations - covering over radar should avoid any lensing effects and minimize signal strength reduction
Design

Design
why it look the way it do
The overall pill-shaped design was chosen to meet several objectives:
Simple design language composed of basic shapes
Minimal sloped surfaces to avoid visible print lines
Shrouded power cable reduces visual clutter and enables cable to be routed from rear of device, through wall penetration
Perimeter vents also serve to break up large, flat front face
Flat front face ensures that radar signals are undistorted
Clips were used to secure the rear panel and the lower cover snaps in. The device enclosure uses no additional hardware. Several internal baffles ensure that light from the power LED is not visible from the exterior when the lower cover is attached. The enclosure was sized to ensure that the radar antenna ground plane would comfortably fit. Several flexures are incorporated into the design to ensure that the PCB is correctly constrained, and to allow secure, satisfying mounting to the stand and wall mount accessories.
No additional hardware was used with the exception of laser cut panels which are incorporated into the wall mount to allow the use of command strips to attach the device to residential walls without risk of damage; due to the matte texture of the prints, most tapes/adhesives do not adhere well to them.
Radome
A radome was incorporated into the design by thinning the enclosure thickness directly over the sensor as well as sizing the device such that the interfaces between air and nylon that the radar looks through are correctly positioned so that reflections destructively interfere and have a minimal impact on device performance.

PCB
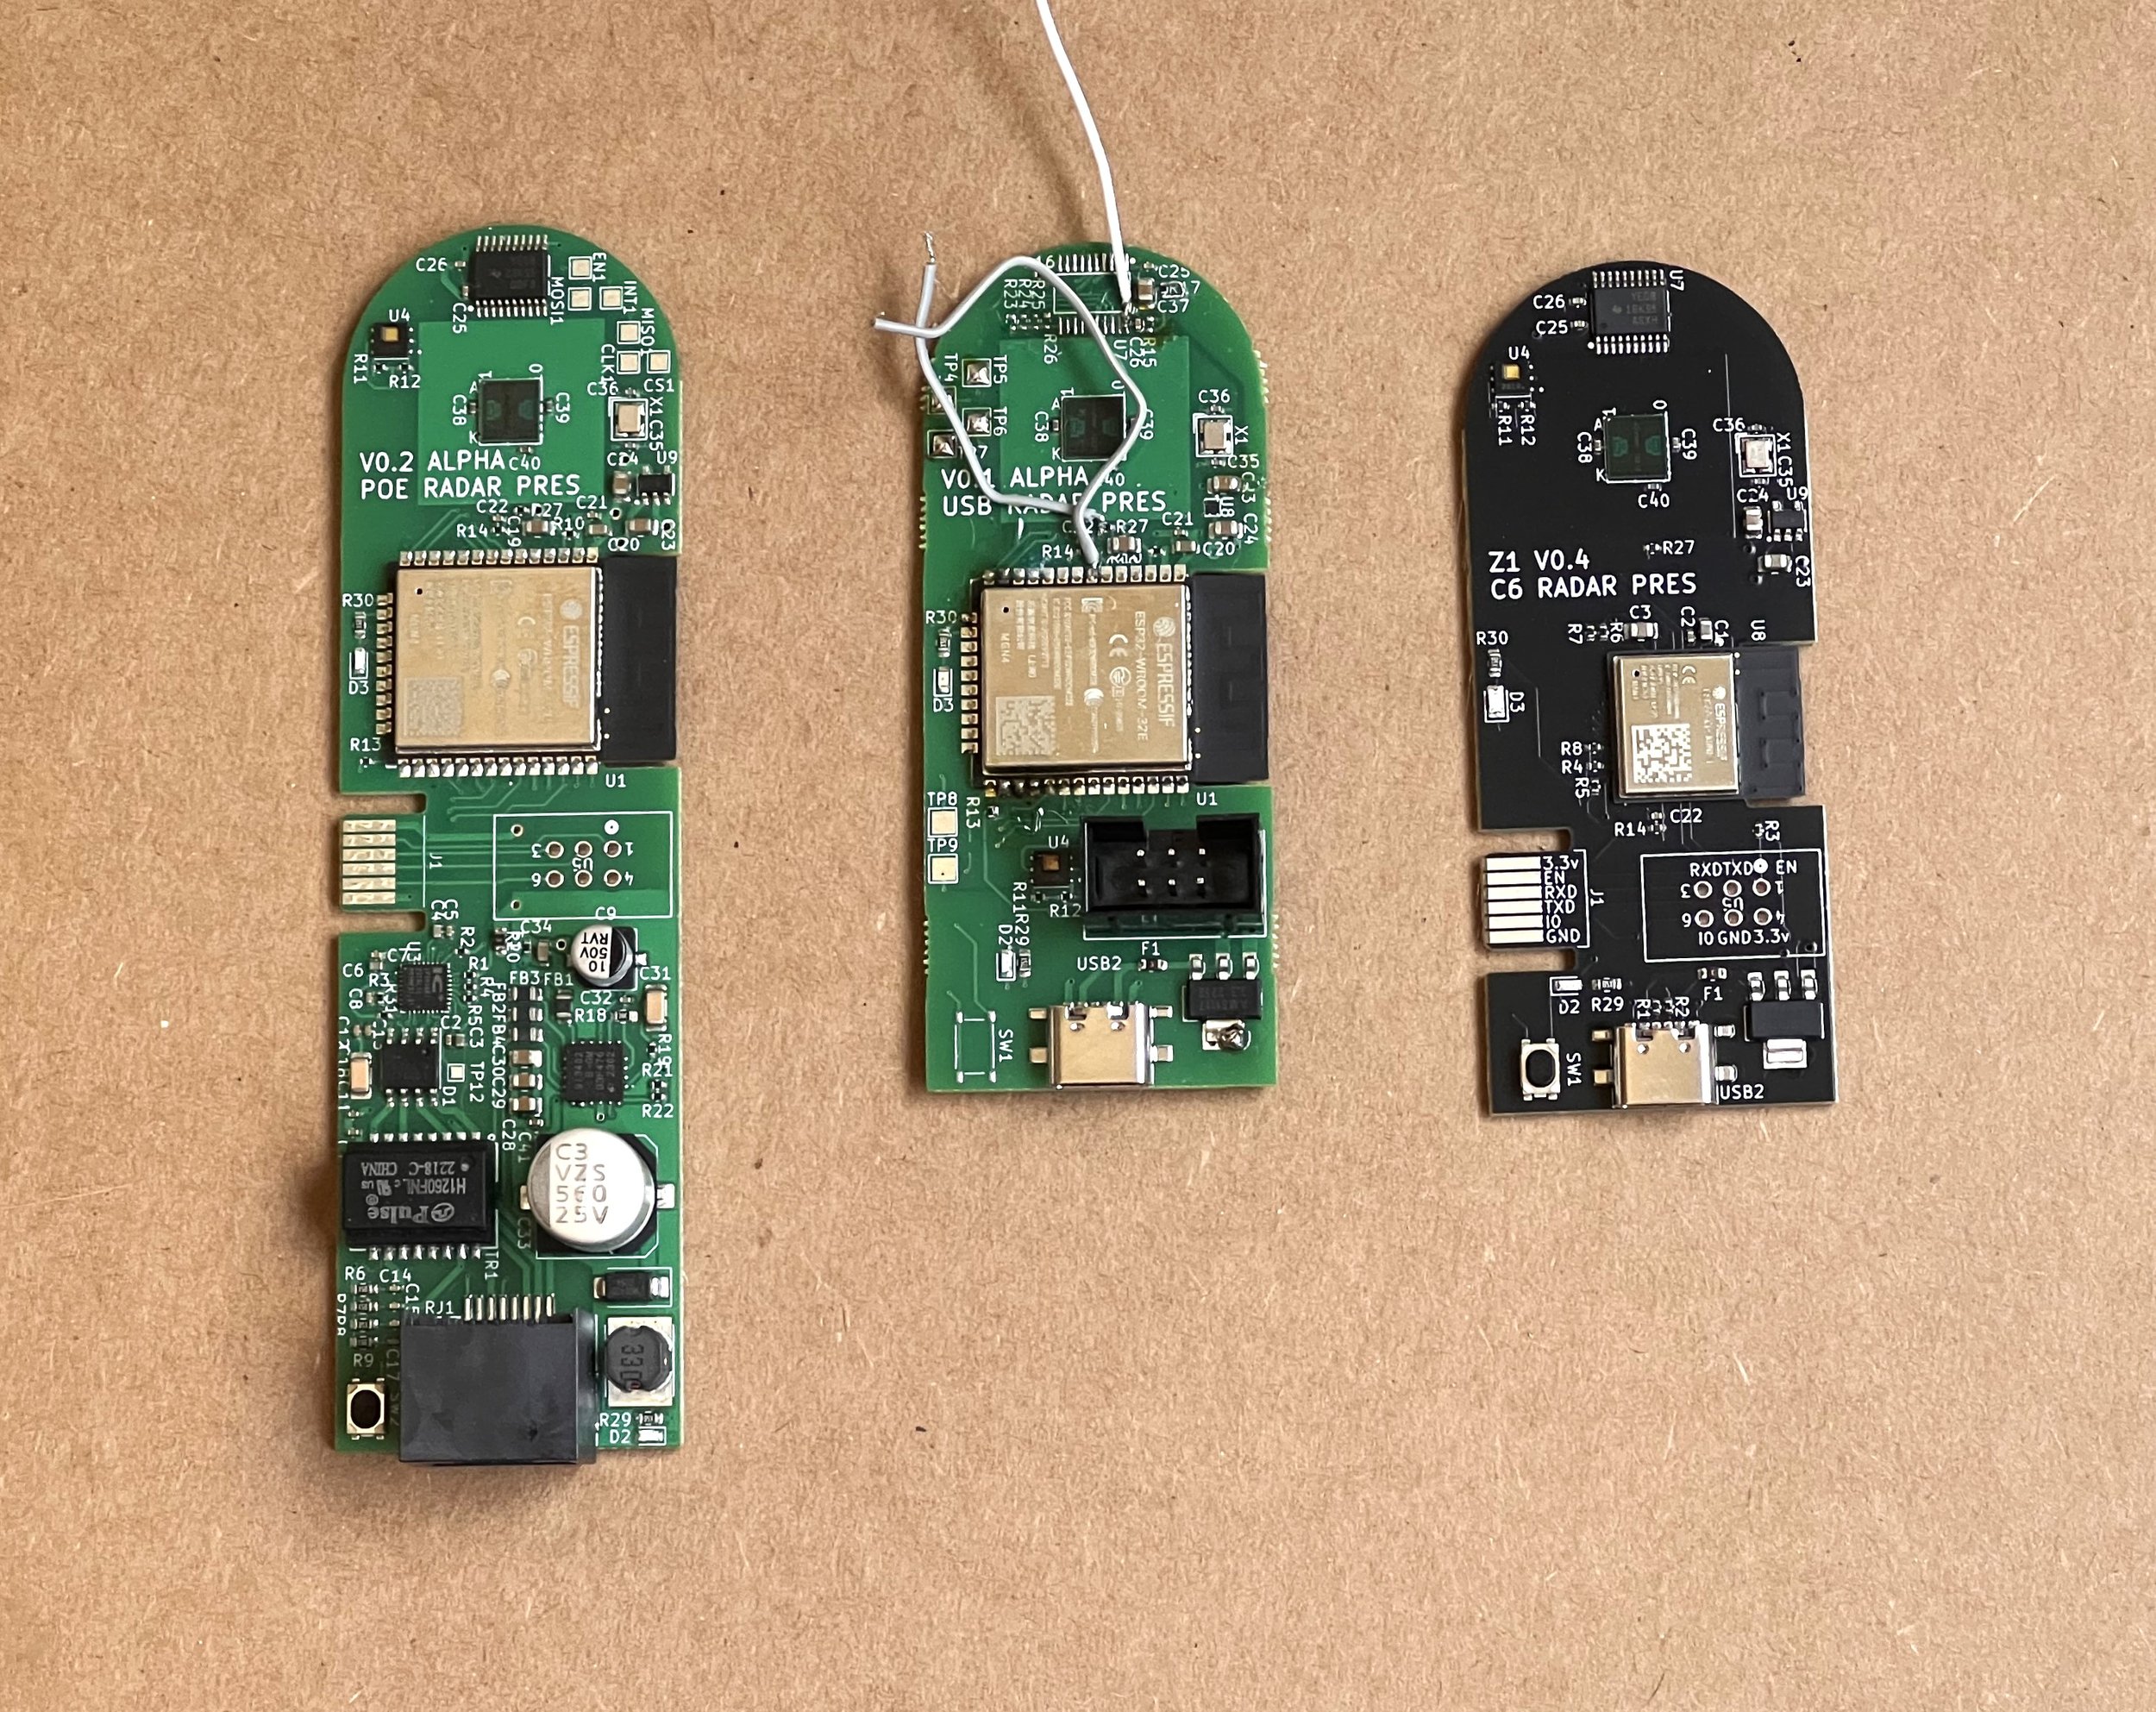
The system is based off an ESP32-C6 running freeRTOS. This was chosen for its low cost, wide support, sufficient computing power to process radar data, and integrated WiFi and IEEE 802.15.4 (Zigbee/Thread) radios.
The PCB uses only surface mount components and is sourced fully assembled from an overseas vendor.
It incorporates a board-edge connector which is used to electrically interface with an off-board serial converter which is used to flash the device during manufacturing.
In addition to the radar chip and MCU, the PCB also contains the USB C port which supplies power, associated data line resistors and linear regulator, a temperature/humidity chip which communicates over I2C, a logic level shifter and oscillator for the radar module, and some associated LEDs and a button.
Software
System Architecture
The device firmware has several key components which work together to provide the device’s full functionality, including
Radar manager
Zigbee manager
OTA Server
Indicator light
System manager
Logger
Detection Algorithm
Processing radar data turned out to be much harder to do reliably than initially expected. The root of the problem is that the radar cannot resolve the scene in very much detail, and while it is fairly easy to isolate movement in the signal, it is not easy to determine whether the movement is due to a person or something else, such as an appliance, fan, curtains, plants, or some other moving object. Accurately classifying scenes without generating excessive of false positive triggers while maintaining enough sensitivity to reliably pickup people is critical to device functionality, and is something that many other first-generation devices (and the radar chip vendor-supplied occupancy detection algorithm) struggle with.
Running raw radar data through an FFT proved a very valuable technique to isolate different motion speeds (since the sensor performs IQ sampling on the return signal, the frequencies in the return signal contain information about the speed of objects which are measured)
Initial attempts focused on using a classically programmed algorithm to process the FFT spectrogram and determine whether there were large blobs which might represent a person. However, this ultimately proved unworkable as the techniques would either be insufficiently sensitive to maintain a lock on people sitting particularly still or at some distance from the device. Many implementations also proved extremely sensitive to parameters used to isolate signal from noise, meaning that it was unlikely that a single set of parameters would work across a wide range of environments. Manually specifying a convolution kernel or other processing technique while correlating results against the wide variety of test cases and sensor samples I already had at this point quickly proved infeasible.
Ultimately, I ended up using a convolutional neural network to classify each slice of radar data. While the total network size and complexity were limited by the requirement to run on a microcontroller in real-time, even a fairly simple network proved more accurate


Web Frontend
An early design goal was for the device to be standards-compliant (in this case, with the Zigbee Home Automation standard). While this was not an issue for basic functionality like temperature/humidity and occupancy reporting, the Zigbee standard was insufficiently flexible for other functionality that was needed, such as advanced configuration and diagnostics reporting.
Since the ESP32-C6 was WiFi-capable, this feature was used to host a WiFi access point with a self-hosted web server which could be connected to from any web browser to upload new firmware images, view and change settings, and download logs. This part of the firmware was originally derived from an MIT-licensed open source project, with a substantial amount of added functionality.
The final version used the Chartist plotting library and a minifier to compact the site’s script and CSS to fit on the small amount of available memory.


Temperature/Humidity Calibration
When operating, the device dissipates up to about 1.5 watts which causes some self-heating within the enclosure. Since the temperature/humidity sensors are also within the enclosure, their readings had to be compensated to accurately reflect external conditions.
While I had initially thought it might be necessary to perform a fairly complicated correction involving the measured rate of change of temperature over time and a physics-based correction for humidity, correlation of recorded data against a reference device ended up showing that time-domain effects were very small and a purely linear correction yielded very accurate results.

Test Infrastructure
Early on in the build process it quickly became apparent that there would need to be a way to remotely monitor and visualize sensor data to determine if the device was working and determine how the detection algorithm needed to be tuned to get the best performance. Over time, what started as a quick-and-dirty visualization in Excel developed in to a diagnostic firmware image as well as an accompanying server program and several utility scripts were developed to help with device testing.
Together, these tools allowed sensors to be deployed while continuously recording raw radar data to a centralized server. This data could then be analyzed to determine if the results matched expectations, and then train new versions of the detection algorithm to perform better in the future.
The final version of this continuous testing infrastructure consisted of some 7 servers and 18 test devices deployed in 6 aparments and homes, and generated 20GB of test data per day.


